Banner

Banner
Showing posts with label solar cycle. Show all posts

Friday, August 12, 2016

A Couple Quick Updates

by Stephanie Osborn
http://www.stephanie-osborn.com

SOLAR UPDATE:
The Sun has definitely awakened for the time. (Finally.) There are currently half a dozen spot groups on the solar near side; 2571 is about to rotate to the far side, but there are also 2573-7 as well, which range from a simple single spot to a multi-spot complex.


Solar Dynamics Observatory imagery
Labeling by Solarham.com
Note how the spots tend to cluster around the equatorial region. This is pretty typical for late in a solar cycle. Sunspots tend to start out at higher latitudes, closer to the poles, then drift equatorward.

Very minor C-class flares are occurring, but there is little chance for anything stronger. A filament did lift, and this may produce a small coronal mass ejection, or CME. We're waiting on LASCO (Large Angle and Spectrometric Coronagraph, an instrument on SOHO, the Solar and Heliospheric Observatory) imagery to determine if it made a CME or not. Such CMEs tend not to be as strong as those associated with large flares, so even if it is Earth-directed, expect pretty aurorae and a few high-latitude effects, but nothing of significance.

There are some coronal holes, but they aren't "geoeffective" (aimed at Earth). Geomagnetic activity is quiet.


Solar Dynamics Observatory imagery
Labeling by Solarham.com

More data as it comes in.

* * *

PERSEID METEOR SHOWER:
Well, the night of August 11/12 was the absolute peak of the Perseids. I've just come in from spending about 20 minutes outside, having a look. (It's currently 4am local time.)

I have to say that I was underwhelmed, especially given the hype given to the predictions of "up to 200 meteors/hour." That comes out to be over 3 meteors per minute, or about one meteor every 15-20 seconds. So in 20 minutes, I should have seen around 66 meteors.

I saw about 1/10 that.

Now, granted, I'm in a subdivision and my skies are not the darkest. And we had some light patchy clouds moving through. But  I waited until after the moon had set before I went out, to have the darkest possible skies for my location. And I picked the clearest patches of sky to observe, and ensured I blocked any light sources. Keep in mind that I've observed this shower from this location numerous times before, as well, so I know what I'm looking for. And I've seen the Perseids storm, the year after the parent comet, Swift-Tuttle, came through -- both from a rural dark-sky site, and my yard, where I was tonight.

 
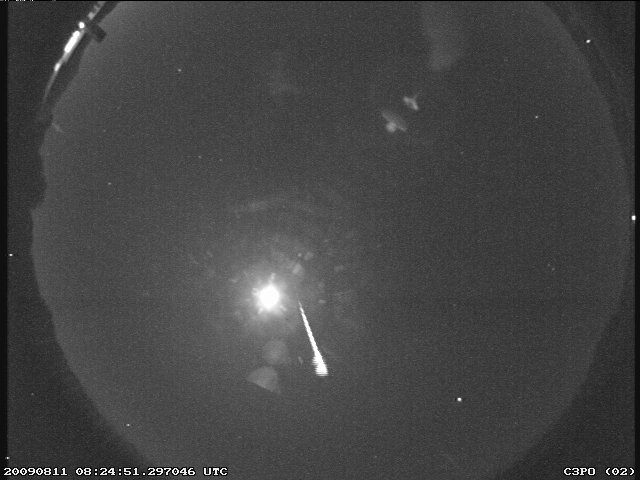
Bill Cooke, NASA Meteoroid Environment Office,
Huntsville, AL
August 10, 2009

I undoubtedly would have seen more meteors had I been in a dark-sky site. But ten times more? Really?

It's possible, also, that I simply picked a time when, coincidentally, we were going through a sparse patch -- I was busy writing, and lost track of time, or I'd have been out there earlier, for longer. I'll be interested to see what other observers have to say.

As for me -- I love the Perseids; they're gorgeous, bright fireball meteors. But this didn't come anywhere close to the spectacle I remember right after Swift-Tuttle came through. That was one I'll always remember. Tonight, not so much.

If you were out observing the Perseids, I'd love to hear your observations in the comments.

* * *

BOOK RECOMMENDATIONS:

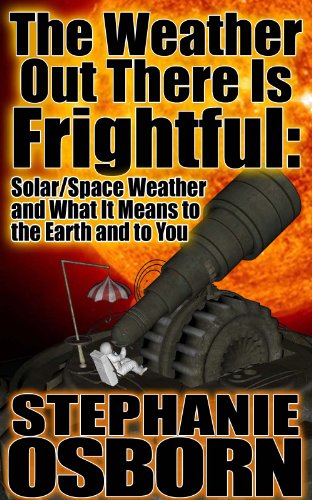
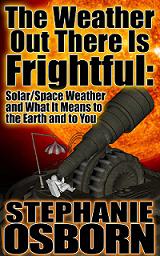
For more information on solar activity, check out my ebook, The Weather Out There Is Frightful: Solar/Space Weather and What It Means for the Earth and You.


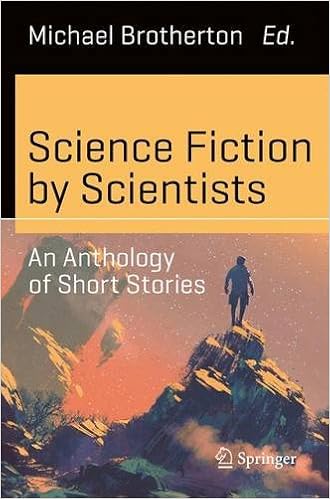
Just a quick promo for me and my fellow scientists, for those of you who are interested in such things: A new anthology will be released in September (we hope!) called Science Fiction By Scientists. Every short story in it is "hard SF" written by an actual scientist, along with a quick primer at the end of each story on the science involved. It's available for preorder now!


~Stephanie Osborn
http://www.stephanie-osborn.com

Thursday, August 4, 2016

Throw-Back Thursday: Some Quick Look-Backs and Current Updates

by Stephanie Osborn
http://www.stephanie-osborn.com


Okay, folks, just a quick look into the past for those of you interested; this whole concept started off when a fellow author named Sarah Hoyt asked me to guest-blog for her about solar activity. Since then, she asked me back, so I have two posts on her blog about solar activity, one of which is only a few weeks old. Rather than re-post the whole thing here, I am simply going to link to her blog, to the particular articles in question.

So here's the first one, with lots of background info. It was first posted in May of 2015.
https://accordingtohoyt.com/2015/05/30/solar-space-and-terrestrial-weather-some-reflections-by-stephanie-osborn/

And here is the second one, which was posted in early July 2016.
https://accordingtohoyt.com/2016/07/15/here-spot-cmere-spot-by-stephanie-osborn/

I still get notifications on these from Sarah's blog, and will answer if you have questions, so feel free to post questions or comments, here or there, or in the Osborn Cosmic Weather Report group on Facebook.

For those who want even more information, I strongly recommend picking up my ebook, The Weather Out There Is Frightful: Solar/Space Weather and What It Means for the Earth and You. It's written by a professional astronomer (me) trained in spotted variable star science, for lay people with little to no science background.


CURRENT SOLAR UPDATE: As of this writing (early 4 Aug) we are currently in our fourth consecutive day of no visible sunspots on the near side. This is the fourth group of spotless days since June 1st. The total number of spotless days since that date currently totals 24 out of 64, or 37.5%. If we add in the days with only a tiny, short-lived spot group in that same time frame, we add in 9 more days, or 33 out of 64, at 51.6%.


A visible-light image of the Sun, taken by the Solar Dynamics Observatory on August 2, 2016, depicting a lack of sunspots on the solar near side.
~~~

HOUSEKEEPING NOTE: Oh, by the way, abusive comments and/or argumentative comments will be moderated on the Comet Tales blog and in the Facebook group. And I reserve the right not to answer such posts on Sarah's blog. I don't put up with trolling. I have better things to do with my time.

~Stephanie Osborn
http://www.stephanie-osborn.com

Monday, August 1, 2016

A New Direction

by Stephanie Osborn
http://www.stephanie-osborn.com
1 August 2016

Effective today, I'm taking Comet Tales in a new direction.

Many of you know me as an author. Many know me as a scientist. Oddly, many do NOT know me as BOTH.

So I'm going to show y'all how it works! Starting today, Comet Tales is going to feature the latest information in solar weather, and space weather and news! Alongside that will be information on my latest book releases, and any titles of mine that pertain to the space news of the day!

I won't be posting on a completely regular basis; rather, I'll post on an as-needed basis to ensure you have the most up-to-date information I've got! That might be once a day, it might be once a week, depending on what's happening. It may be a longish post, detailing and explaining a solar event, or it may be a link to a detailed article, with a few comments. So keep up with the blog! Follow me, and you'll always know the latest going on in the space above our atmosphere!


Today's space news:


Asteroid Bennu

We've got a little time, but asteroid 101955 Bennu could cause problems in about 120 years:
http://news.sky.com/story/asteroid-strike-could-cause-immense-suffering-10519054

It's unlikely but not impossible.

Can we do anything about it? Yes.

Travis S. Taylor and I discussed that in our nonfiction book, A New American Space Plan. There are many possible ways to redirect an asteroid or comet, and we cover them all in our book. Check it out!


Sunspots/Solar Activity

Also we have yet another day with no visible sunspots. If the active sunspots that rotated off about 5 days ago have survived, they would seem to be the only spots on the solar surface. The most recent imagery from the STEREO website (which is NOT on the Solarham website, which has begun updating less and less frequently in recent weeks) indicates that they have indeed survived and are nearing the center of the solar farside disk.

Spot group 2570, which showed up to end the last no-spot run, dissipated on Saturday; another short-lived binary spot group showed up on Sunday but didn't even stay around long enough to be numbered, and now, officially August 2nd GMT/UTC, we are back to no spots.

If I count the "dinky" spots as being essentially no spots, then 30 out of the last 63 days have had little to no sunspots visible (47.6%). 22 out of 63 were unequivocally spotless (34.9%).

And yes, I do know a thing or two about this -- my graduate work was in spotted variable star astronomy. I have an ebook out about solar variability called The Weather Out There Is Frightful, and it talks about spots, flares, coronal mass ejections, the solar cycle, extended minima, and more. 


~Stephanie Osborn
http://www.stephanie-osborn.com

Monday, June 25, 2012

Space Weather - The Carrington Event


In August of 1859, during historic Solar Cycle 10, something very strange began to happen. The Sun, as it neared solar max, grew unusually active. It produced prolific numbers of sunspots and flares, some of which were visible to the naked eye. This continued through the end of the month, until, just before noon on September 1, British astronomer Richard Carrington, just 33 and already acknowledged as one of England's premier solar astronomers, observed an incredibly brilliant solar flare – a flare that was easily visible to the naked eye. In later times, this single flare became known as The Carrington Super-Flare. In his own words from his scientific records:

“...Within the area of the great north group [of sunspots]...two patches of intensely bright and white light broke out...My first impression was that by some chance a ray of light had penetrated a hole in the [projection] screen...for the brilliancy was fully equal to that of direct sun-light; but by at once interrupting the current observation, and causing the image to move by turning the R.A. [right ascension, an astronomical coordinate akin to longitude] handle, I saw I was an unprepared witness to a very different affair...The instant of the first outburst was not 15 seconds different from 11h 18m Greenwich mean time, and 11h 23m was taken for the time of disappearance [from the telescope's view]. In this lapse of 5 minutes, the two patches of light traversed a space of about 35,000 miles...”

British amateur astronomer Richard Hodgeson also observed it; Balfour Steward at the Kew Observatory noted a “crochet” effect on the observatory's magnetometer. (A “crochet” is also sometimes called a Sudden Ionospheric Disturbance, or SID. It is when a solar event produces an abnormally high plasma density – remember, plasma is like the stuff in your fluorescent lights – in one layer of the ionosphere. This in turn creates literal electric currents running through the ionosphere, which magnetometers pick up. It creates something of an invisible lacy pattern in the atmosphere, hence, I suppose, the term “crochet.”)

And all of the previous flares and coronal mass ejections had fairly effectively cleared the interplanetary medium between the Sun and Earth.

The enormous coronal mass ejection produced by the super-flare slammed into Earth in only 17 hours.

The resulting effects lasted several days.

What kind of effects?

Worldwide aurorae for starters. These aurorae were most noted in the Caribbean, where they had never been seen before. Colorado gold miners, awakened by the brightening skies, got up and began cooking their breakfasts, because they thought it was dawn. In Europe and the northeastern United States, newspapers could be read by the light of the aurorae.

Speaking of newspapers, the Baltimore American and Commercial Advisor spoke of the ongoing event in poetic terms. “Those who happened to be out late on Thursday night had an opportunity of witnessing another magnificent display of the auroral lights. The phenomenon was very similar to the display on Sunday night, though at times the light was, if possible, more brilliant, and the prismatic hues more varied and gorgeous. The light appeared to cover the whole firmament, apparently like a luminous cloud, through which the stars of the larger magnitude indistinctly shone. The light was greater than that of the moon at its full, but had an indescribable softness and delicacy that seemed to envelop everything upon which it rested. Between 12 and 1 o'clock, when the display was at its full brilliancy, the quiet streets of the city resting under this strange light, presented a beautiful as well as singular appearance.”

Those dealing in the business of telegraphy did not think so highly of the display. The incredibly intense event, a maximal G5 and S5 by any definition, created induced currents in telegraph wires that were simply impossible to control. Lines and pylons threw sparks, telegraph batteries were blown, telegraphers received severe shocks, and telegraph “flimsy” paper burst into flames.

And yet some telegraph systems continued to function, despite having no batteries to power them. The induced current was simply that strong.

This was the Carrington Event, the most powerful solar/geomagnetic storm ever to occur in recorded history. It was before the advent of electricity, or electronics, or integrated grids and networks, save for telegraph systems, with which it wreaked havoc. Imagine what effect it would have today.


Dibs on the story.    ;-)


-Stephanie Osborn

Monday, June 18, 2012

Solar-Earth DefCon Levels, Part 2


Now, while all of this stuff is going on in the geomagnetic field, what's happening in space? Hard radiation, and lots of it, that's what. After all, that's basically what's causing the disturbance in the geomagnetic field.

And of course NOAA has another scale that relates to that, called the solar storm scale, and represented by – you guessed it – S.

There's not a direct correlation that I've ever been able to find between the G scale and the S scale, because the S scale is determined by the number of protons of a given energy that passes through, say a square meter in a second. This number is called the proton flux. (In the case of the S scale, the energy of the protons must be greater than or equal to 10MeV, where MeV is mega-electron-volts. An electron volt is very tiny, only 1.6x10⁻¹⁹ joules. So an MeV is an energy of 1.6x10⁻¹² joules. It's not big, but when you're talking about something as small as a proton, it's big enough.)

So at S1, our proton flux is 10 protons per second per steradian per square centimeter. (This is not a very big area. The bigger the number of protons passing through, the bigger the radiation dose.) An S1 is a minor solar storm. According to NOAA, the effects are as follows, “Biological: none. Satellite operations: none. Other systems: minor impacts on HF radio in the polar regions.” This happens a lot, but not quite as often as a G1 – an S1 occurs about 50 times per solar cycle.

An S2 is a moderate solar storm. It requires a proton flux of 100, and occurs half as often as an S1. Effects: “Biological: passengers and crew in high-flying aircraft at high latitudes may be exposed to elevated radiation risk. Satellite operations: infrequent single-event upsets possible. [A single-event upset, or SEU, is when the bit of a computer is accidentally reset to its opposite condition by a proton or electron impact.] Other systems: small effects on HF propagation through the polar regions and navigation at polar cap locations possibly affected.”

S3 is a little stronger still; it's a “strong” solar storm, with a proton flux of 1000. (Note that the solar storm scale is a logarithmic scale like the Richter scale, with each step of the scale having 10x greater proton flux than the previous.) Only 10 of these typically occur per solar cycle, but they aren't pleasant. “Biological: radiation hazard avoidance recommended for astronauts on EVA; passengers and crew in high-flying aircraft at high latitudes may be exposed to radiation risk. Satellite operations: single-event upsets, noise in imaging systems, and slight reduction of efficiency in solar panel are likely. Other systems: degraded HF radio propagation through the polar regions and navigation position errors likely.”

Stepping up to an S4, a severe solar storm, we have a proton flux of 10,000. They are pretty rare, with only about 3 per solar cycle occurring. “Biological: unavoidable radiation hazard to astronauts on EVA; passengers and crew in high-flying aircraft at high latitudes may be exposed to radiation risk. Satellite operations: may experience memory device problems and noise on imaging systems; star-tracker problems may cause orientation problems, and solar panel efficiency can be degraded. Other systems: blackout of HF radio communications through the polar regions and increased navigation errors over several days are likely.”

And finally the granddaddy of solar storms, the S5, the extreme storm. It has a proton flux of 100,000 protons per second per steradian per square centimeter. Simply put, a flood of 100,000 protons is striking every square centimeter (less than half an inch each way), every second. These are very rare, and may or may not occur in any given solar cycle. But they can be devastating. “Biological: unavoidable high radiation hazard to astronauts on EVA (extra-vehicular activity); passengers and crew in high-flying aircraft at high latitudes may be exposed to radiation risk. Satellite operations: satellites may be rendered useless, memory impacts can cause loss of control, may cause serious noise in image data, star-trackers may be unable to locate sources; permanent damage to solar panels possible. Other systems: complete blackout of HF (high frequency) communications possible through the polar regions, and position errors make navigation operations extremely difficult.”

We're fortunate those don't occur very often at all.

But even the typical description of a G5 or S5 doesn't match the strongest geomagnetic storm in history.


-Stephanie Osborn

Monday, June 11, 2012

Solar-Earth DefCon Levels, Part 1

As I told you last week, NOAA has a scale of geomagnetic activity that ranges from G0 to G5, where G0 is quiescent, and G5 is the worst geomagnetic storm around. Now, we've already talked a little bit about what geomagnetic storms do...

No, we didn't, you say?

Ah, but we did. Back when I told you about all the effects that Coronal Mass Ejections can have. (Solar, Space, and Geomagnetic Weather, Part 4.) Because those sorts of things are what cause the geomagnetic storms.

But probably the best way I can tell you about the effects is simply to quote from NOAA's scale itself (which can be found here: http://www.swpc.noaa.gov/NOAAscales/#GeomagneticStorms).

As I mentioned last week, a G0 is the normal, quiescent geomagnetic field. This holds until the Kp index reaches 5, and then we begin minor geomagnetic storming, with the scale hitting G1. According to NOAA, “Power systems: weak power grid fluctuations can occur. Spacecraft operations: minor impact on satellite operations possible. Other systems: migratory animals are affected at this and higher levels; aurora is commonly visible at high latitudes (northern Michigan and Maine).” These are fairly frequent, with on average close to 2000 per 11-year solar cycle.

At Kp=6, G2 is considered a moderate storm. “Power systems: high-latitude power systems may experience voltage alarms, long-duration storms may cause transformer damage. Spacecraft operations: corrective actions to orientation may be required by ground control; possible changes in drag affect orbit predictions. Other systems: HF radio propagation can fade at higher latitudes, and aurora has been seen as low as New York and Idaho (typically 55° geomagnetic lat.).” These are a little less frequent than G1, but still occur at a rate of about 600 every solar cycle.

When Kp=7, G3 is a strong geomagnetic storm. “Power systems: voltage corrections may be required, false alarms triggered on some protection devices. Spacecraft operations: surface charging [static electricity buildup; this can lead to arcing]may occur on satellite components, drag may increase on low-Earth-orbit satellites, and corrections may be needed for orientation problems. Other systems: intermittent satellite navigation and low-frequency radio navigation problems may occur, HF radio may be intermittent, and aurora has been seen as low as Illinois and Oregon (typically 50° geomagnetic lat.).” These are less frequent still, with on average 200 per solar cycle. Also, as the geomagnetic storms increase in strength, their likelihood of occurrence tends to concentrate around solar maximum, though this is not a hard and fast rule.

At Kp=8, G4 is a severe geomagnetic storm. “Power systems: possible widespread voltage control problems and some protective systems will mistakenly trip out key assets from the grid. Spacecraft operations: may experience surface charging and tracking problems, corrections may be needed for orientation problems. Other systems: induced pipeline currents affect preventive measures, HF radio propagation sporadic, satellite navigation degraded for hours, low-frequency radio navigation disrupted, and aurora has been seen as low as Alabama and northern California (typically 45° geomagnetic lat.). These are rarer still, with only about 100 seen per solar cycle.

And then there's the big boys. Kp=9 means a G5 extreme geomagnetic storm. “Power systems: widespread voltage control problems and protective system problems can occur, some grid systems may experience complete collapse or blackouts. Transformers may experience damage. Spacecraft operations: may experience extensive surface charging, problems with orientation, uplink/downlink and tracking satellites. Other systems: pipeline currents can reach hundreds of amps, HF (high frequency) radio propagation may be impossible in many areas for one to two days, satellite navigation may be degraded for days, low-frequency radio navigation can be out for hours, and aurora has been seen as low as Florida and southern Texas (typically 40° geomagnetic lat.).” These are the rarest of all, but still occur on average 4 per solar cycle.


-Stephanie Osborn


Monday, June 4, 2012

Solar Activity and the Activity Indices

Okay, back to bar magnets again. Because the Earth has one. But of course it's three-dimensional, not like our iron filings on paper example. Imagine picking up the bar magnet with the iron filings and paper attached, and rotating it 360º, letting the iron filings remain in the areas they move through. Now you have an image of what a three-dimensional dipolar (2-pole) magnetic field looks like – sort of like a giant pumpkin. With the solar wind (which is probably the largest influence on the interplanetary magnetic field) pushing on it from the Sun direction, the side of the pumpkin facing the Sun tends to smush in, but the side away from the Sun tends to stretch out and form a long tail. (You can see a really good animation of how this works here: http://en.wikipedia.org/wiki/File:Animati3.gif) This is all to say that you HAVE to think of the geomagnetic field three-dimensionally. And if it is three-dimensional, then each part of the field has an x-, a y-, and a z-coordinate component.

Let's simplify for a minute. Let's say that we're going to look at the component of the geomagnetic field that is running horizontally to the Earth's surface at any given point. Now because the Earth is curved, this is a tangent line that is continually changing as you move around the Earth. Now let's look at the disturbances from normal, caused by solar weather – coronal holes, CMEs, what have you.

So we have these variations, that are going to be different for different parts of the Earth for the same event. How do we measure it? It's a little like a Richter scale for geosolar storms. It runs from zero to nine, and there's a special formula that enables it to be calculated regardless of the location of the observatory, just like the Richter magnitude of a quake can be determined from seismographs on the opposite side of the globe. This scale for solar-induced geomagnetic activity is called the K-index. Zero is essentially no activity; anything above 5 is considered a storm level of activity. The bigger the number, the greater the effects seen on the ground, and the farther south the auroral oval can be seen. At a K=9, the aurora can be seen...in the TROPICS.

(Just for the sake of more information, the letter K was derived from the German word “kennziffer,” which apparently means “characteristic number.” Us scientists, we love our imaginative names, you know?)
Now if we reference the Kp index, we're talking about the interplanetary K index, not the geomagnetic K index. This is an average of all the K indices from all of the observatories, weighted as appropriate (remember, you won't get the same measurements from the various observation sites, so you have to factor that in, as well as the fact that the geomagnetic field is constantly changing). This gives us an indication of what the interplanetary magnetic field (IMF) is doing. BUT – not all of the stations report in at the same time. So then scientists have to calculate something called the “estimated Kp” which is just what it sounds like – an estimate for those stations that haven't reported in yet. This can sometimes be a very good predictor of what the magnetic field is going to do, and sometimes not so much. We're still very much learning this particular science.

But we're not done with indexes. There's also something called the a index. This is based on the AMPLITUDES (yep, there's the reason for using an a) of the deviations from geomagnetic normal, taken over a three-hour period. Then there's the A index, which is an AVERAGE (yep, that's where the A came from) of all the a-indices for a 24-hour period.
One more index we need to look at is the G scale, which is the National Oceanic and Atmospheric Administration's (NOAA) way of quantifying the strength of the geomagnetic disturbance. For any K index of 4 or less, the scale shows G0. At K=5, we jump to G1 – minor storming. For K=6, we have G2. For K=7, G3. At K=8, we have a storm level of G4, and at the maximum K=9, we have maximum storming of G5. Think of it like the Earth's solar DefCon level.

Next week we'll go into those DefCon levels in detail.


-Stephanie Osborn

Monday, May 21, 2012

Solar, Space, and Geomagnetic Weather, Part 4

So what the heck are CMEs?

Coronal Mass Ejections are gigantic explosions that occur, usually in the vicinity of particularly active sunspot groups (though not always). We're still discovering what they are, how they occur, and why they do what they do. It seems to get into some complicated electromagnetic physics and something called “magnetic reconnection.”

Think about it like this. Suppose you have two bar magnets, lying near each other but, say, perpendicular to each other. Each has its own magnetic field, with field lines that go out from one pole and arc around to the other pole (remember our discussion of iron filings a couple weeks ago?), but now we've got them close enough that those magnetic fields interact.

Suppose – just suppose – a field line broke away from its parent magnet and attached the opposite end to the other magnet? Now suppose a whole SEGMENT of field lines did that. Those bar magnets would start dancing a whirligig, and the magnetic field would go crazy.

Now suppose that the bar magnets are swirling plasma gases, and the field lines are running through more swirling plasma.

THAT is magnetic reconnection. The end result is that a whole bunch of energy gets transferred from the field into kinetic energy. This heats up the plasma AND accelerates it, and, at least on the surface of a star like our Sun, a titanic explosion is the result. A great big blob of plasma goes flying out into space, and that blob is a “coronal mass ejection,” because a big mass of the corona just got ejected from the Sun. (Imaginative name, huh?)

The vast majority of them aren't THAT big, and aren't even Earth-directed. The chances of one smacking Earth aren't that big. But because there are a lot of them, especially at solar max, it happens fairly often. Sometimes it's just the edge of the expanding bubble, but sometimes it whacks Earth upside the head. And when they come in, they're coming fast.

So what are the general parameters of a CME? Depends on where in the solar cycle you are. If you're near solar minimum, they occur about one every 5 days or so. If you're around solar max, expect one every 6 or 7 hours. How big are they? If you're talking volume, that's gonna depend on how far out from the Sun they are, and how well the interplanetary medium is allowing them to hold together. If you're talking how massive, well, on average they're about 3,520,000,000 lb (1,600,000,000,000 kg). That's over three and a half trillion pounds of plasma. On average, their speed is about 304 mi/s or 1.1 million mph (490km/s). IF, however, one follows close on the heels of another, so that the first one has swept most of the interplanetary medium out of the way (decreasing drag), the speed can increase to 2,000 mi/s or 7.2 million mph (3,200 km/s). And with the Sun 93 million miles away, that means a fast CME can reach Earth in just under 13 hours.

-Stephanie Osborn
http://www.stephanie-osborn.com