Banner

Banner
Showing posts with label space. Show all posts

Monday, August 1, 2016

A New Direction

by Stephanie Osborn
http://www.stephanie-osborn.com
1 August 2016

Effective today, I'm taking Comet Tales in a new direction.

Many of you know me as an author. Many know me as a scientist. Oddly, many do NOT know me as BOTH.

So I'm going to show y'all how it works! Starting today, Comet Tales is going to feature the latest information in solar weather, and space weather and news! Alongside that will be information on my latest book releases, and any titles of mine that pertain to the space news of the day!

I won't be posting on a completely regular basis; rather, I'll post on an as-needed basis to ensure you have the most up-to-date information I've got! That might be once a day, it might be once a week, depending on what's happening. It may be a longish post, detailing and explaining a solar event, or it may be a link to a detailed article, with a few comments. So keep up with the blog! Follow me, and you'll always know the latest going on in the space above our atmosphere!


Today's space news:


Asteroid Bennu

We've got a little time, but asteroid 101955 Bennu could cause problems in about 120 years:
http://news.sky.com/story/asteroid-strike-could-cause-immense-suffering-10519054

It's unlikely but not impossible.
Can we do anything about it? Yes.

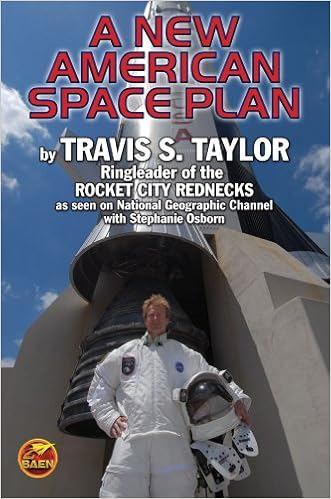
Travis S. Taylor and I discussed that in our nonfiction book, A New American Space Plan. There are many possible ways to redirect an asteroid or comet, and we cover them all in our book. Check it out!


Sunspots/Solar Activity

Also we have yet another day with no visible sunspots. If the active sunspots that rotated off about 5 days ago have survived, they would seem to be the only spots on the solar surface. The most recent imagery from the STEREO website (which is NOT on the Solarham website, which has begun updating less and less frequently in recent weeks) indicates that they have indeed survived and are nearing the center of the solar farside disk.
Spot group 2570, which showed up to end the last no-spot run, dissipated on Saturday; another short-lived binary spot group showed up on Sunday but didn't even stay around long enough to be numbered, and now, officially August 2nd GMT/UTC, we are back to no spots.

If I count the "dinky" spots as being essentially no spots, then 30 out of the last 63 days have had little to no sunspots visible (47.6%). 22 out of 63 were unequivocally spotless (34.9%).

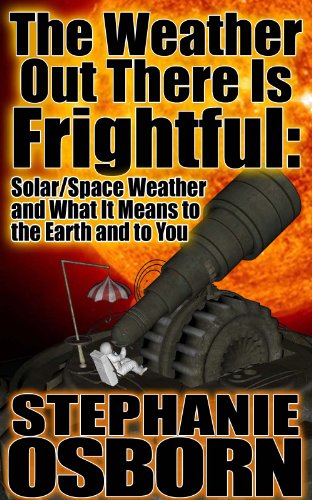
And yes, I do know a thing or two about this -- my graduate work was in spotted variable star astronomy. I have an ebook out about solar variability called The Weather Out There Is Frightful, and it talks about spots, flares, coronal mass ejections, the solar cycle, extended minima, and more. 


~Stephanie Osborn
http://www.stephanie-osborn.com

Monday, June 18, 2012

Solar-Earth DefCon Levels, Part 2


Now, while all of this stuff is going on in the geomagnetic field, what's happening in space? Hard radiation, and lots of it, that's what. After all, that's basically what's causing the disturbance in the geomagnetic field.

And of course NOAA has another scale that relates to that, called the solar storm scale, and represented by – you guessed it – S.

There's not a direct correlation that I've ever been able to find between the G scale and the S scale, because the S scale is determined by the number of protons of a given energy that passes through, say a square meter in a second. This number is called the proton flux. (In the case of the S scale, the energy of the protons must be greater than or equal to 10MeV, where MeV is mega-electron-volts. An electron volt is very tiny, only 1.6x10⁻¹⁹ joules. So an MeV is an energy of 1.6x10⁻¹² joules. It's not big, but when you're talking about something as small as a proton, it's big enough.)

So at S1, our proton flux is 10 protons per second per steradian per square centimeter. (This is not a very big area. The bigger the number of protons passing through, the bigger the radiation dose.) An S1 is a minor solar storm. According to NOAA, the effects are as follows, “Biological: none. Satellite operations: none. Other systems: minor impacts on HF radio in the polar regions.” This happens a lot, but not quite as often as a G1 – an S1 occurs about 50 times per solar cycle.

An S2 is a moderate solar storm. It requires a proton flux of 100, and occurs half as often as an S1. Effects: “Biological: passengers and crew in high-flying aircraft at high latitudes may be exposed to elevated radiation risk. Satellite operations: infrequent single-event upsets possible. [A single-event upset, or SEU, is when the bit of a computer is accidentally reset to its opposite condition by a proton or electron impact.] Other systems: small effects on HF propagation through the polar regions and navigation at polar cap locations possibly affected.”

S3 is a little stronger still; it's a “strong” solar storm, with a proton flux of 1000. (Note that the solar storm scale is a logarithmic scale like the Richter scale, with each step of the scale having 10x greater proton flux than the previous.) Only 10 of these typically occur per solar cycle, but they aren't pleasant. “Biological: radiation hazard avoidance recommended for astronauts on EVA; passengers and crew in high-flying aircraft at high latitudes may be exposed to radiation risk. Satellite operations: single-event upsets, noise in imaging systems, and slight reduction of efficiency in solar panel are likely. Other systems: degraded HF radio propagation through the polar regions and navigation position errors likely.”

Stepping up to an S4, a severe solar storm, we have a proton flux of 10,000. They are pretty rare, with only about 3 per solar cycle occurring. “Biological: unavoidable radiation hazard to astronauts on EVA; passengers and crew in high-flying aircraft at high latitudes may be exposed to radiation risk. Satellite operations: may experience memory device problems and noise on imaging systems; star-tracker problems may cause orientation problems, and solar panel efficiency can be degraded. Other systems: blackout of HF radio communications through the polar regions and increased navigation errors over several days are likely.”

And finally the granddaddy of solar storms, the S5, the extreme storm. It has a proton flux of 100,000 protons per second per steradian per square centimeter. Simply put, a flood of 100,000 protons is striking every square centimeter (less than half an inch each way), every second. These are very rare, and may or may not occur in any given solar cycle. But they can be devastating. “Biological: unavoidable high radiation hazard to astronauts on EVA (extra-vehicular activity); passengers and crew in high-flying aircraft at high latitudes may be exposed to radiation risk. Satellite operations: satellites may be rendered useless, memory impacts can cause loss of control, may cause serious noise in image data, star-trackers may be unable to locate sources; permanent damage to solar panels possible. Other systems: complete blackout of HF (high frequency) communications possible through the polar regions, and position errors make navigation operations extremely difficult.”

We're fortunate those don't occur very often at all.

But even the typical description of a G5 or S5 doesn't match the strongest geomagnetic storm in history.


-Stephanie Osborn

Monday, June 4, 2012

Solar Activity and the Activity Indices

Okay, back to bar magnets again. Because the Earth has one. But of course it's three-dimensional, not like our iron filings on paper example. Imagine picking up the bar magnet with the iron filings and paper attached, and rotating it 360ยบ, letting the iron filings remain in the areas they move through. Now you have an image of what a three-dimensional dipolar (2-pole) magnetic field looks like – sort of like a giant pumpkin. With the solar wind (which is probably the largest influence on the interplanetary magnetic field) pushing on it from the Sun direction, the side of the pumpkin facing the Sun tends to smush in, but the side away from the Sun tends to stretch out and form a long tail. (You can see a really good animation of how this works here: http://en.wikipedia.org/wiki/File:Animati3.gif) This is all to say that you HAVE to think of the geomagnetic field three-dimensionally. And if it is three-dimensional, then each part of the field has an x-, a y-, and a z-coordinate component.

Let's simplify for a minute. Let's say that we're going to look at the component of the geomagnetic field that is running horizontally to the Earth's surface at any given point. Now because the Earth is curved, this is a tangent line that is continually changing as you move around the Earth. Now let's look at the disturbances from normal, caused by solar weather – coronal holes, CMEs, what have you.

So we have these variations, that are going to be different for different parts of the Earth for the same event. How do we measure it? It's a little like a Richter scale for geosolar storms. It runs from zero to nine, and there's a special formula that enables it to be calculated regardless of the location of the observatory, just like the Richter magnitude of a quake can be determined from seismographs on the opposite side of the globe. This scale for solar-induced geomagnetic activity is called the K-index. Zero is essentially no activity; anything above 5 is considered a storm level of activity. The bigger the number, the greater the effects seen on the ground, and the farther south the auroral oval can be seen. At a K=9, the aurora can be seen...in the TROPICS.

(Just for the sake of more information, the letter K was derived from the German word “kennziffer,” which apparently means “characteristic number.” Us scientists, we love our imaginative names, you know?)
Now if we reference the Kp index, we're talking about the interplanetary K index, not the geomagnetic K index. This is an average of all the K indices from all of the observatories, weighted as appropriate (remember, you won't get the same measurements from the various observation sites, so you have to factor that in, as well as the fact that the geomagnetic field is constantly changing). This gives us an indication of what the interplanetary magnetic field (IMF) is doing. BUT – not all of the stations report in at the same time. So then scientists have to calculate something called the “estimated Kp” which is just what it sounds like – an estimate for those stations that haven't reported in yet. This can sometimes be a very good predictor of what the magnetic field is going to do, and sometimes not so much. We're still very much learning this particular science.

But we're not done with indexes. There's also something called the a index. This is based on the AMPLITUDES (yep, there's the reason for using an a) of the deviations from geomagnetic normal, taken over a three-hour period. Then there's the A index, which is an AVERAGE (yep, that's where the A came from) of all the a-indices for a 24-hour period.
One more index we need to look at is the G scale, which is the National Oceanic and Atmospheric Administration's (NOAA) way of quantifying the strength of the geomagnetic disturbance. For any K index of 4 or less, the scale shows G0. At K=5, we jump to G1 – minor storming. For K=6, we have G2. For K=7, G3. At K=8, we have a storm level of G4, and at the maximum K=9, we have maximum storming of G5. Think of it like the Earth's solar DefCon level.

Next week we'll go into those DefCon levels in detail.


-Stephanie Osborn

Thursday, August 6, 2009

My first PopSyndicate article is up!

It's called It Ain't Rocket Science - Oh Wait, It Is! This month's article is on the World Science Fiction Convention which is this weekend!