My experience
I did my graduate work in spotted variable stars at
Vanderbilt University, so in the astronomical community I would be considered a
variable star astronomer. Based on our experience, many variable star
astronomers consider the Sun to be at least borderline variable, and I am one
of these. In point of fact, pretty much across the board, astronomers dropped
the “solar constant” years ago, because it simply wasn’t. (Unfortunately, other
disciplines have not.)
I personally have been watching solar activity for many years
now and have watched the activity gradually decrease. As a consequence, I began
keeping a rough spreadsheet in summer 2016 as I watched activity begin to drop
dramatically. So I have about 2 years of recorded data. It is fairly
simplistic, because I only wanted a snapshot and didn’t have time to do more
detail, but it serves the purpose, as we will see shortly.
The current solar cycle
This graph is the latter part of solar cycle 23 and all of
cycle 24, roughly to date. (Note, however, that the plot ends in ~March 2018.
It’s very difficult to find plots that are current to the month.) The red line
is the projected curve. The blue line is the smoothed curve. The purple dots
and jagged line are the actual data.
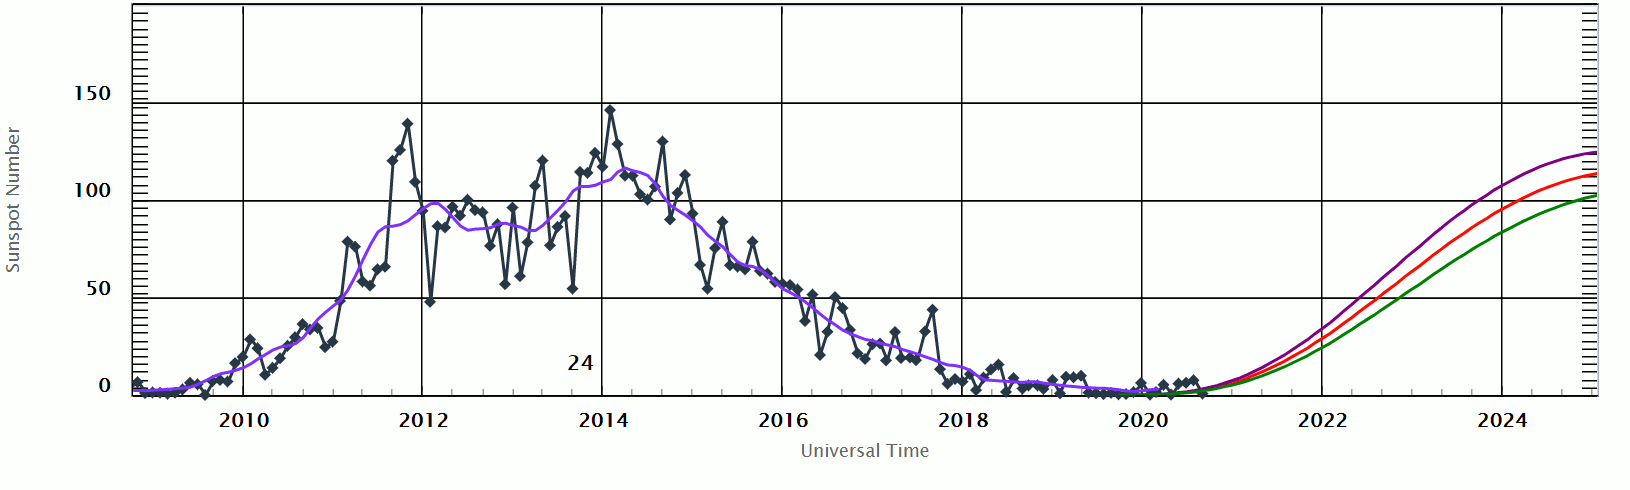
Note that the peak for 24 was approximately half that of 23.
Also note that we are currently already as low as the minimum that ended cycle
23, at approximately 8.5-9 years into an average-11-year cycle. Theoretically,
we still have a couple of years to go before the actual minimum is reached,
though 11 years IS an average.
Recent solar cycles
Here is a graph presenting solar cycles 14-24(current). This
takes us back to around 1900AD. Note the decrease in the height of the peak
(solar max) of each cycle since ~1980. Note the decreased activity in cycle 20.
Note the gradual increase in peak height from 1900-1960, though there is a
slight drop in cycle 16, around 1930.

Long-term observations
This next chart goes back a LITTLE farther. This is a view of
activity over the last 400 years. Note that this graph does NOT include cycle
24; it stops at 23. Cycle 24 is already at roughly the same level as the cycles
found in the Dalton Extended Minimum, and this has been noted by several groups
with experience in the field.

An interesting correlation
This is a clipping from a Michigan newspaper which was sent
to me a couple of months ago. Note the article date written in the margin.


My data (2016)

Legend:
Column 1 is the year.
Column 2 is the month.
Column 3 is the percentage of days in that month with no more
than 1 sunspot/sunspot group.
Column 4 is the percentage of days in that month with NO
sunspots.
My data (2017)

My data (2018 — incomplete)

My data, graphed (total)

Legend:
The dark green line represents the percentage of days in any
given month with no more than 1 numbered sunspot group.
The light green line represents the percentage of days in any
given month with no sunspot group.
The latest data
I haven’t had a chance to include the last couple of months
of data in the charts as yet. However, in brief synopsis, May had 77.4% of days
with no more than 1 sunspot group, and two sets of seven consecutive spotless
days. June was much the same, with another spotless week early on; another
session of spotless days began June 27th...and continued through the
entirety of July. Today, as I write this, it is July 31st, and we
have had 35 consecutive spotless days. Since it takes about 24.5 days for the
solar equatorial regions to rotate once around its axis, this means that we
have seen the entire photosphere spotless; not even the solar farside has
spots, and this appears to be corroborated by the STEREO solar observing
platforms. A couple of short-lived, almost-spot plages developed during this
period, on July 3rd and 21st, but otherwise there were no
visible photospheric features. Virtually the only other solar activity came
from the enhanced solar wind streams from coronal holes, and even those are
diminishing in size and strength.
Other solar activity
Flare numbers are decreasing; CME numbers are decreasing. BUT
cosmic ray flux is increasing. Why? And what do all those words mean, anyway?
Sunspots, flares, and coronal mass ejections (CMEs) are all
related; flares tend to produce CMEs, and tend to form near spots. This is
because they are all magnetic events. A sunspot is believed to be the “snarl”
produced in the magnetic field lines as a result of differential rotation —
since the Sun is not a solid body, it does not rotate uniformly; rather, it
follows Kepler’s Laws of orbital motion. The poles rotate faster than the
equator, and the interior rotates faster than the photosphere. But since it is
a plasma body, and plasma is composed of charged particles, it generates a
strong magnetic field. As this differential rotation proceeds, the field lines
gradually wrap up. If (among other things) local inhomogeneities occur, the
field strength can vary, and the field lines may “snarl.” But they also tend to
move upward as the plasma convects. When the snarls reach the photosphere — the
visible surface — they are slightly cooler, hence darker, and appear as
sunspots.
But these snarls contain carp-tons of magnetic potential
energy. And from time to time, that potential energy manages to release itself,
in the form of a magnetic reconnection event. This is, in essence, the field
trying to simplify itself and untangle, after a fashion — the field lines break
here and reattach over there, in an effort to reshape themselves and eliminate
the snarl. This converts the potential energy into tremendous amounts of other
kinds of energy — thermal
and kinetic, to name a couple — and the result is a flare. This
explosive event can — but does not always — then generate the equivalent of a mushroom cloud,
which blows off the photosphere into the solar system, accelerated by the
reconfiguring magnetic fields. This “mushroom cloud” is the CME.
Given that this differential rotation creates an extremely
complex overall magnetic field, sometimes field lines leave the Sun and stretch
off — essentially to
infinity — in places not normal for a typical dipole (bar) magnet, which
ordinarily would mean JUST the poles. These regions of “infinite field lines”
are visible in certain wavelengths of light as darker regions, due to the
relative lack of plasma in the inner corona, and they are called coronal holes.
The solar wind tends to be “enhanced” along these field lines, since the
magnetic field is effectively accelerating the plasma in these regions. They
are strong, and can create minor geomagnetic storming and aurorae on Earth (or
the other planets) if we pass through that enhanced wind stream, but it won’t
be as strong as getting hit with a big CME.
Cosmic rays are generally subatomic particles of various
sorts, originating from outside our solar system — sometimes outside our galaxy. They are extremely energetic
and are produced by the more powerful cosmic objects out there: pulsars,
magnetars, supernovae, black hole accretion disks, even quasars. They can be
dangerous precisely because they are so energetic, and often if they hit an object,
they produce a cascade of additional particles. (In atmosphere, this is called
a cosmic ray shower.)
BUT, since most of them are charged particles — they’d be incredibly
hot plasma if you got enough of ‘em together in one place — they can be deflected by
magnetic fields. And woo-ha, a moving plasma such as the solar wind constitutes
a current, which in turn generates an interplanetary magnetic field! So this
magnetic field protects the inner solar system from potentially deadly cosmic
radiation. (The term “flux” simply means you’re measuring the number of such
particles passing through a given area — typically a square meter — per
second.)
So. The stronger the interplanetary magnetic field, the
better the protection we have from cosmic rays, and the lower the cosmic ray
flux will be.
BUT.
When the Sun is less active, the slower and less dense the
solar wind will be, hence the weaker the interplanetary field will be.
So we would expect that an active Sun would mean a low cosmic
ray flux, and an inactive Sun would mean a higher cosmic ray flux...and this is
exactly what we see. More, as the solar activity has diminished in recent
years, we have watched the cosmic ray flux increase.


Credit: graph from spaceweather.com
Note: Stratospheric flux tends to be more representative of
solar system fluxes than lower-altitude measurements; this is because the
atmosphere attenuates the rays. Note how the flux has increased from 78x to 88x
that found at sea level.
My thoughts
Based on all this information, it is my considered opinion
that we are about to enter an extended minimum, if we are not already in one.
The double-dynamo solar model predicted one more solar cycle before entering an
extended minimum. However, this model, while able to accurately recreate the shapes
of recent solar cycles, has been unable to adequately model historic extended
minima. It must therefore be concluded that it is not complete. It is my
educated conclusion that it does not go far enough, and there is at least one
more dynamo which needs to be modeled. It is therefore likely that the onset
and the exit of the predicted extended minimum may be “squishy,” and the dates
may vary by as much as a solar cycle or more.
It is very true that “correlation does not equal causation,”
but when correlations begin to mount, it is foolhardy to refuse to consider the
possibility of a coupling mechanism. To name a few correlations:
·
Greenland/Vinland settlement around 1000AD/tail
end of the Roman Warm Period
·
The Little Ice Age/four consecutive extended
minima
·
The Year Without A Summer/Dalton Minimum
·
Snow in summer in 1942/low-activity Cycle 16
preceding
·
Snow in summer in 1979/low-activity Cycle 20
preceding
·
Modern Warm Period/increasing solar activity in
1st half 20th Century
·
Plateau in warming in the 2000’s/gradual
decrease in solar activity since ~1980
Yes, certainly volcanic eruptions and other events factor
into the situation. But how many correlations does it take before we need to
sit up and take notice? Before we seriously start to wonder what is really
going on?
For more on solar activity, check out The Weather Out There Is Frightful ,
by Stephanie Osborn.